OTel Community Day '24

It is Thursday morning and I'm settled back in my home office still processing all the awesomeness from OpenTelemetry Community Day. Here's the highlights from my notes annotated with tons 'o links to help you deep dive into any areas of interest.
Next time you're down by the Seattle Convention Center do yourself a favor and stop by Mr. West Cafe. Unfort due to a horrible experience with an iced sparkling strawberry matcha I can still taste 🤢... I was not bold enough to try the egg cream. I did enjoy a delectable cappuccino and the thickest slice of avo toast in the West.
Hallway Track
If the tech industry is a small world, the o11y world is micro sized, and it was so so so great to catch up with former colleagues (some I'd known since the PeopleOps days!) and some I'd only met online working remotely or from their handles on social media. Another plus was the amicable atmosphere to make new o11y friends, such as Mila Ardath, the dev behind otel-desktop-viewer, a project I learned of last KubeCon!
If your company has a learning/conference/travel budget and you're spearheading OTel initiatives, consider pitching a talk or attending next year's OTel Community Day - great vibes, small intimate sessions, relatively none of the sensory overload that comes with mega-confs like KubeCon.
Opening Remarks
The event kicked off with Austin Parker celebrating the growth in community and contributions sharing some stats like how today there are ~1200 unique developers contributing monthly up from 700-800 a couple years ago.
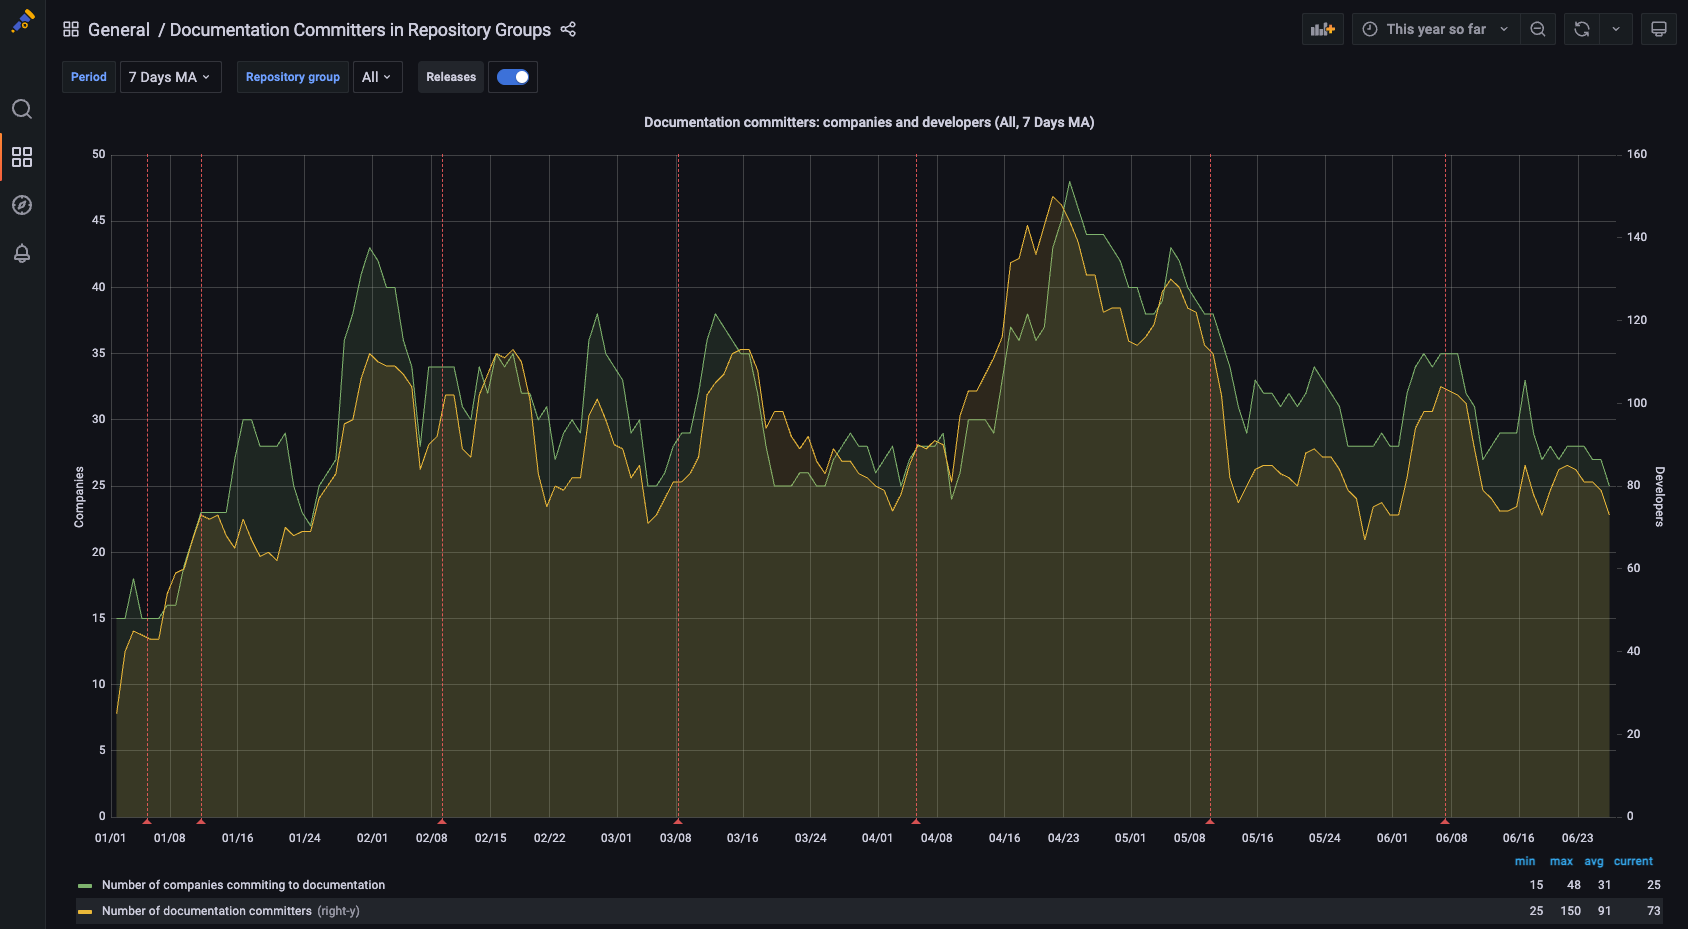
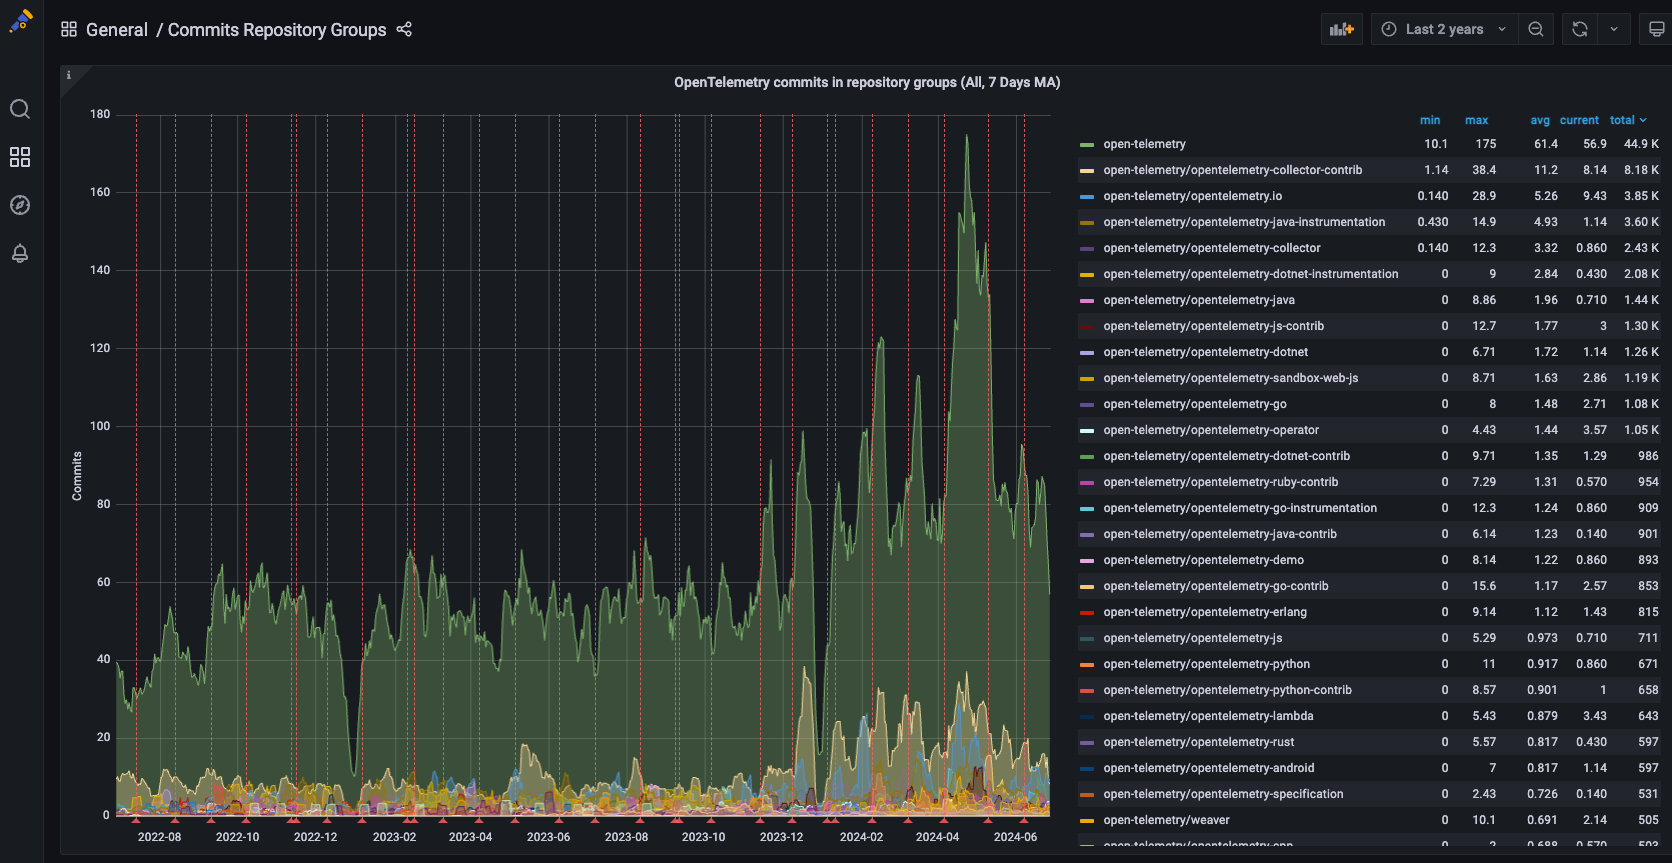
If you too are a data nerd - check out Cloud Native DevStats which "visualizes GitHub archives using HA Postgres dbs and Grafana dashboards deployed via Helm chart to Equinix bare metal K8s nodes" authored by Lukasz Gryglicki! It covers activity across a whole slate of CNCF projects outside of OTel too.
Love to see a whole Documentation Committers by Company and Developer
Or to discover that opentelemetry-collector-contrib is the second most committed to repo!!
Mid-Year Check In
covering what's been accomplished and what's on the horizon
Accelerating development of Profiling signal
CNCF Graduation
Collector 1.0 release
Launching new SIGs
- Developer Experience - https://github.com/open-telemetry/community/pull/2144
- Contributor Experience - https://github.com/open-telemetry/community/pull/2162
- Project Infrastructure/Tooling - https://github.com/open-telemetry/community/pull/2096
OTel Events API & Data Model
This is one I'll be following as Events have the least standardization of any telemetry type across the industry.
- Events API Spec under development: https://github.com/open-telemetry/opentelemetry-specification/blob/main/specification/logs/event-api.md
- Discussion on an open issue to "define the purpose of events in OpenTelemetry" https://github.com/open-telemetry/opentelemetry-specification/issues/4045
Stabilization of HTTP Semantic Conventions
- Semantic Conventions for Spans: https://opentelemetry.io/docs/specs/semconv/http/http-spans/
- Semantic Conventions for Metrics: https://opentelemetry.io/docs/specs/semconv/http/http-metrics/
- (this is marked as Mixed due to experimental metrics http.client.active_requests, attribute url.template for metric http.client.request.body.size
- Handy migration guide: https://opentelemetry.io/docs/specs/semconv/http/migration-guide/
There's no shortage of adoption, contributions, and work to be done here 😄 plenty of places to get involved no matter your experience level with observability!
How OpenTelemetry Helps Generative AI
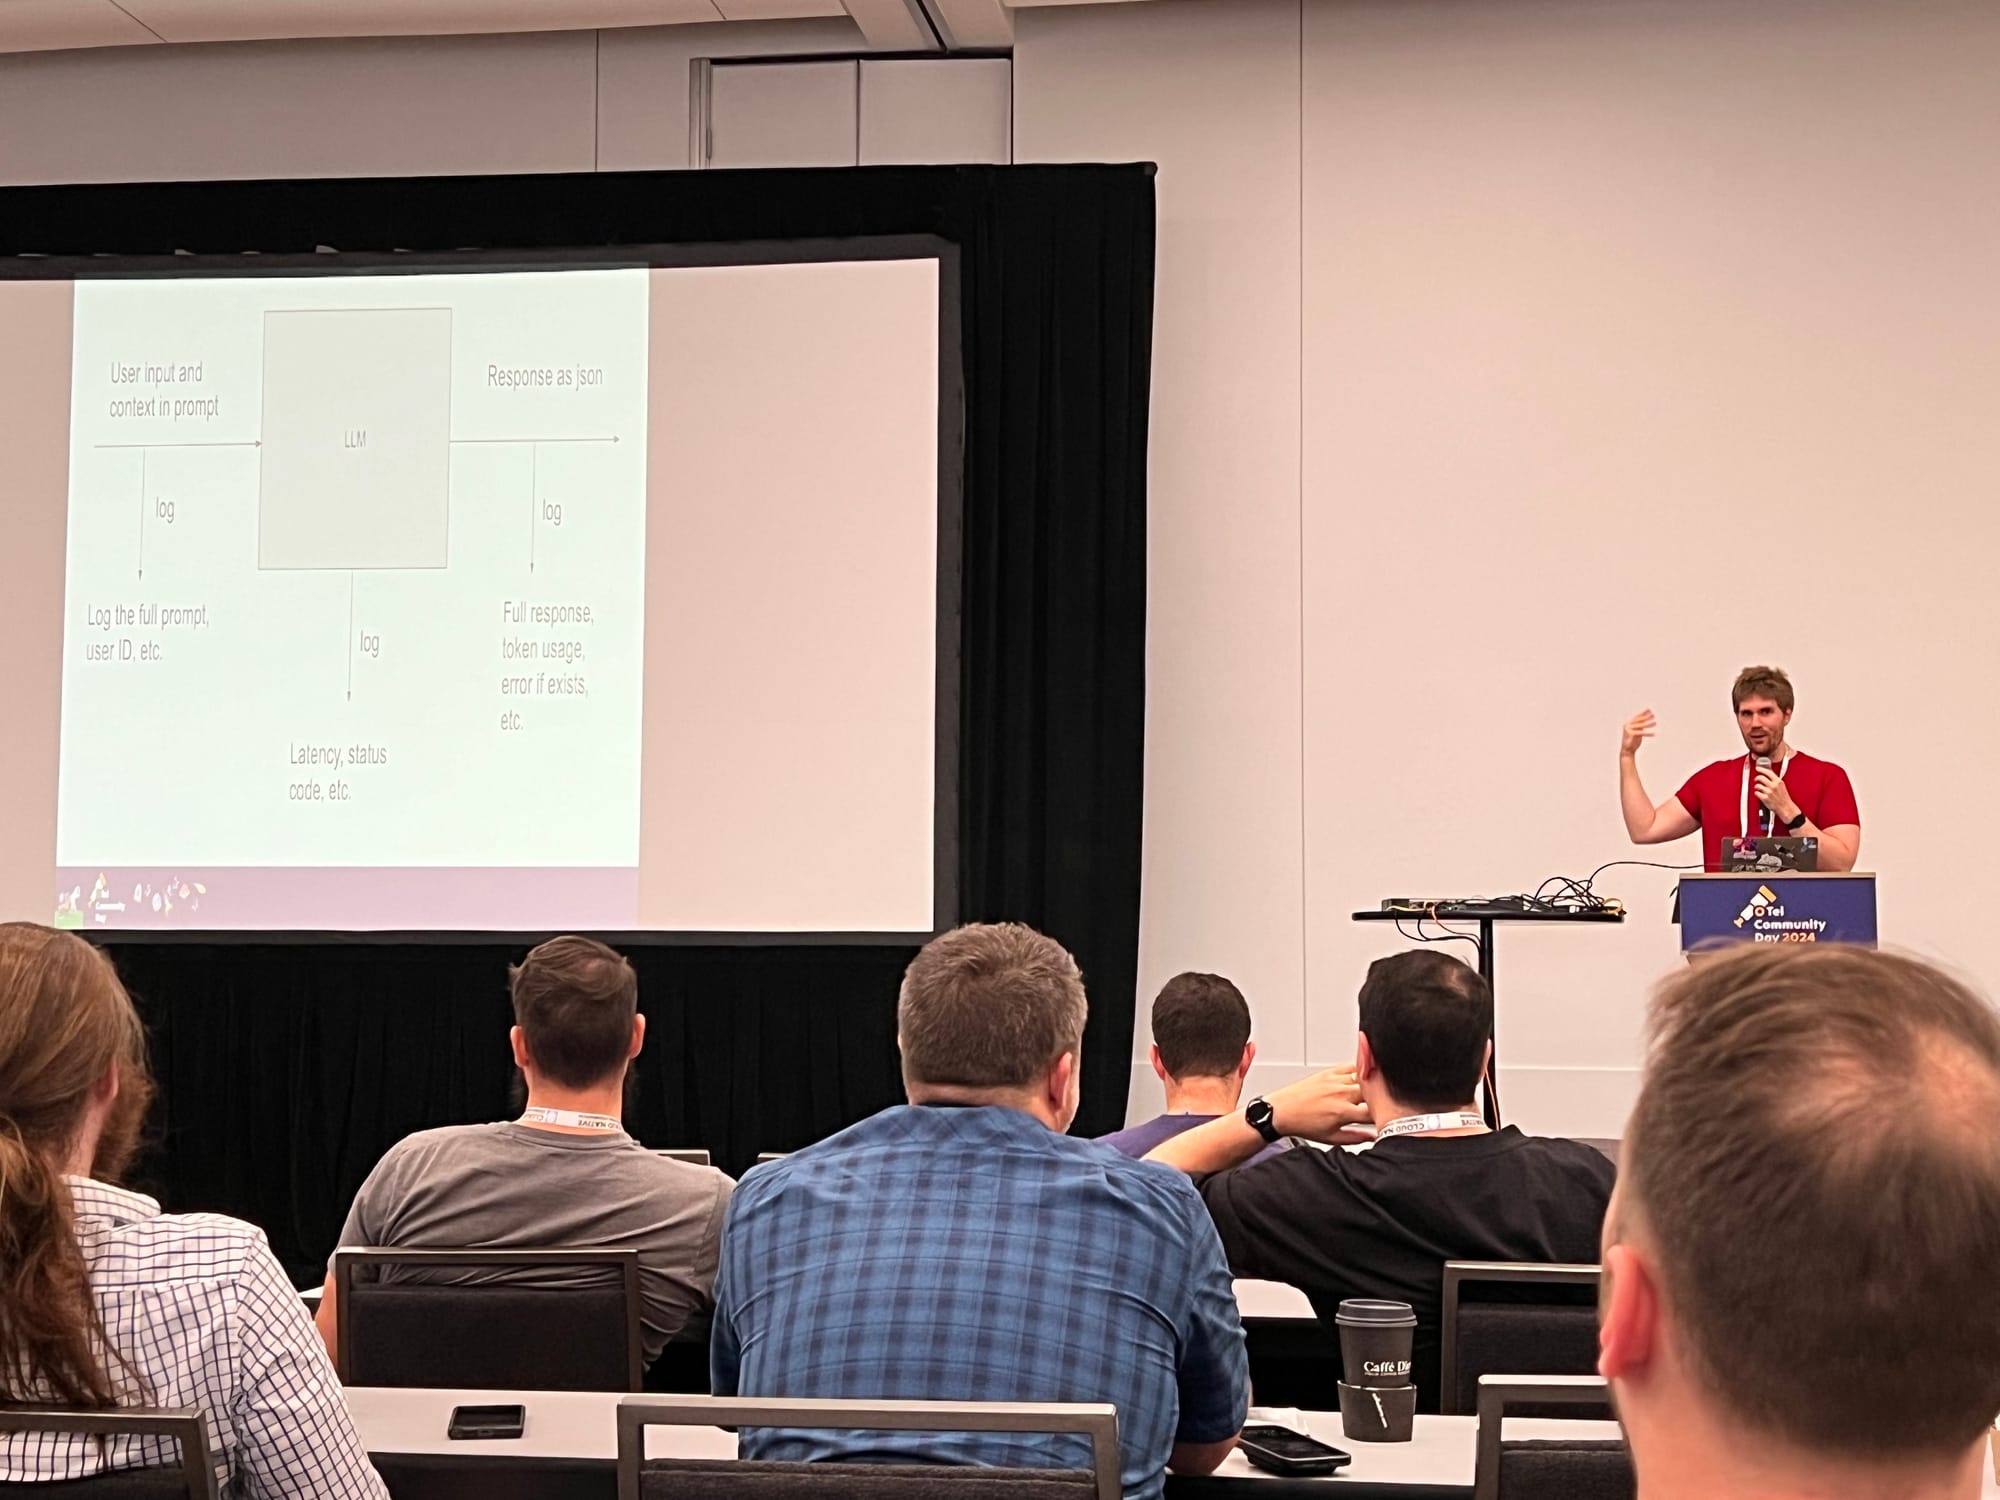
Phillip Carter shared how to improve the user experience of gen AI features by leveraging great observability data from OTel! Really loved hearing the product perspective here and focus on the users - this is the whole point of o11y imo and bonus points for working "inscrutable" into the talk 👏
He suggests the top 2 questions to answer when seeking to improve an AI product are:
- Is the right data being fed to the model?
- Is the model behaving right with the inputs? (great to monitor if you are actually fixing outputs without introducing regressions)
Slides can be found here: https://static.sched.com/hosted_files/otelcommunitydayna24/74/OTel%20Comm%20Day%2024%20GenAI%20O11y.pdf.
There is active ongoing work to nail down Semantic Conventions for common LLM operations across telemetry - join the convo at #otel-llm-semconv-wg over in the CNCF Slack.
Using Native OpenTelemetry Instrumentation to Make Client Libraries Better
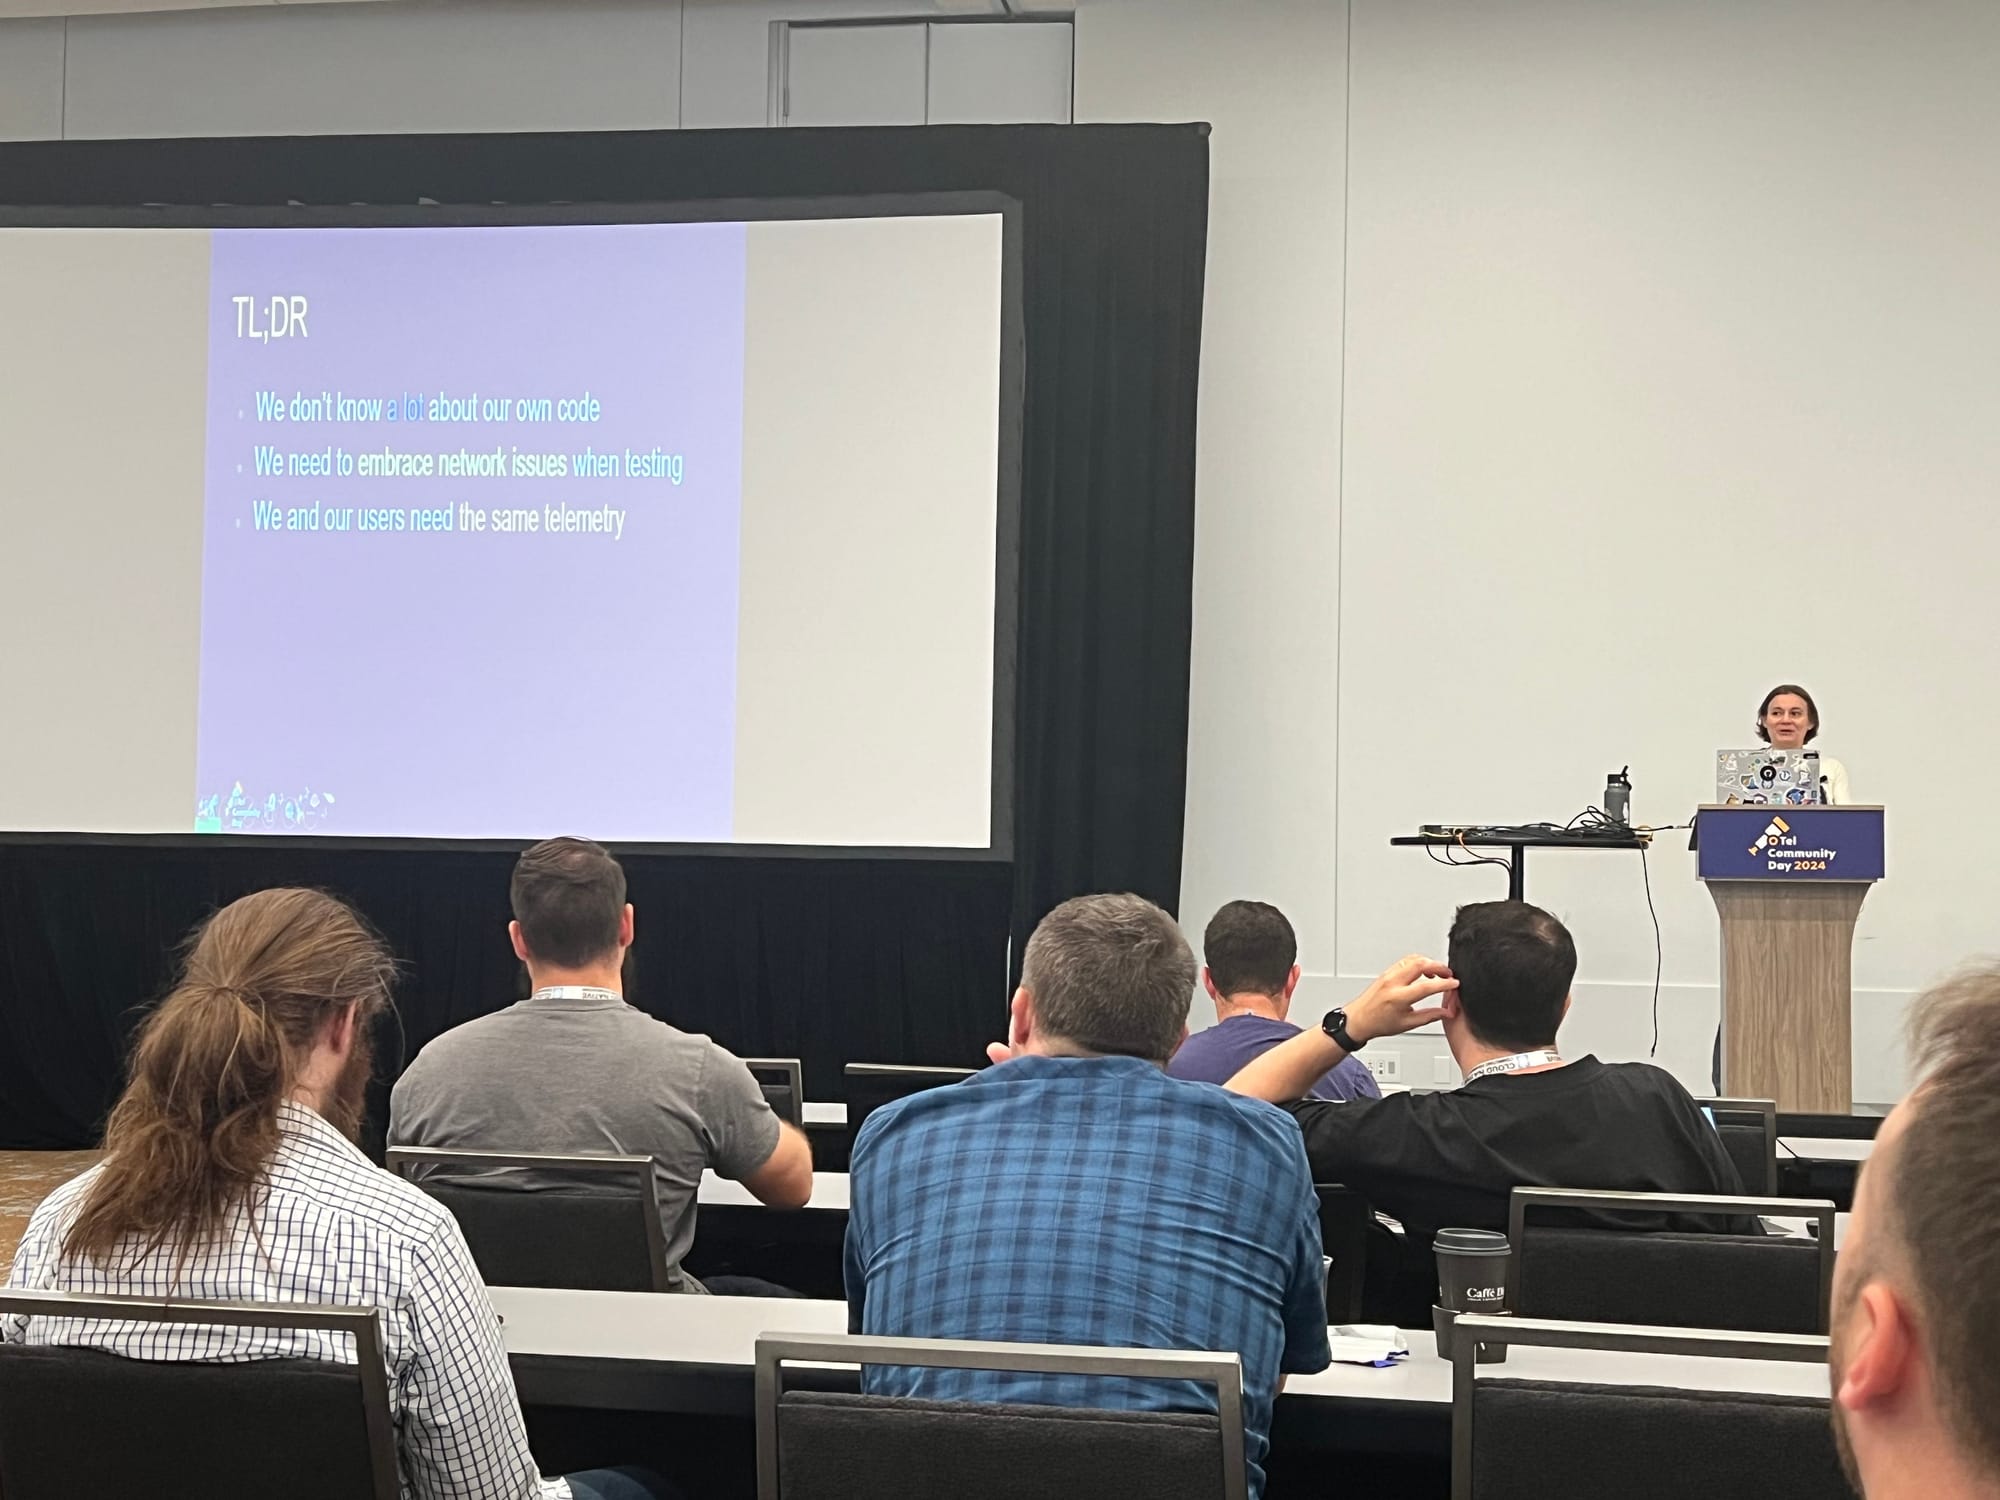
Liudmila Molkova gave my fave presentation of the day shedding light on the experience of client library authors when it comes to observability. She's spot on that we tend to overly focus on application developers and talked about how she's used OTel to optimize performance and increase reliability of Azure client libraries!
What's Different About Client Library O11y?
When users report issues... we (client lib authors) dream of detailed low-level telemetry that is always on, costs nothing, doesn't affect performance that we can access
Library operations are complex ranging from authentication, retries, content buffering/chunking, caching and connection management. Many libraries rely on logs as primary telemetry which can be terrible/voluminous. Shifting to treat libraries as services with same level of monitoring and instrumentation
Performance testing can fail and stop when network errors occur....however in the real world users will inevitably face network errors so leveling up from perf testing to reliability testing can surface many bugs you can prevent
...
I wish I had taken pic of the slides or there was video recorded because these case studies were GOLD and I know I didn't capture all the relevant context.
Case Study 1 - Allocate Buffers of Exact Size
Symptoms: high CPU/memory, lots of time spent in garbage collection with low throughput
Investigated: memory dump
Discovery: specifying the exact buffer size up front
Outcome: 5x increase in throughput. That's major!!!
Case Study 2 - Configure Thread Pool Size for Concurrency
Symptoms: low throughput and low CPU/memory
Investigated: checked the number of threads
Discovery: found a configuration option to properly size the thread pool
Outcome: 5x increase in throughput and better resource utilization. Yay!
Case Study 3 - Never Trust Defaults
Symptoms: high CPU/memory, low throughput and the dreaded OOM
Investigated: memory dump
Discovery: by default the library was set up to fetch messages and would make many, many subsequent requests to prefetch more data. Rewired things so messages were fetched and pre-fetched from a broker in parallel
Outcome: 7x increase in throughput and no OOMs. Behold the power of observability!!
...
I do encourage everyone to adopt Liudmila's format for sharing o11y success - especially for demo hours, team newsletters, and your quarterly performance review 😉
- Initial user observations/report
- Symptoms you noticed
- What data you used to investigate
- The change/mitigation
- Outcome
Tuning OTel Collector Performance Through Profiling
Braydon Kains the codeowner for hostmetricsreceiver and a part of the System Semantic Conventions WG shared the tale of investigating a reported Collector memory leak in the Prometheus Receiver.
While profiling is the shiniest signal in OTel and currently a WIP you do not have to wait for the spec and SDK implementation to land to get started with profiles today! enter - pprof which absolutely should adopt this vintage Word Art logo like today.
Most of the talk was a live demo that went fab despite the mornings A/V aspect ratio issues! You can check out the slides here: https://static.sched.com/hosted_files/otelcommunitydayna24/40/OTel%20Community%20Day%20Profiling.pdf.
The "Zen" of Python Exemplars
(me)
My real goal with this talk was to increase awareness of exemplars and spark interest in someone contributing exemplar support for the Python SDK.
To me being able to hop across tools and types of telemetry is essential for frictionless investigations especially if that o11y data is scattered or siloed across multiple tools and why I appreciate exemplars letting you quickly jump from "hmm I can see that errors are high on the metrics chart for the monitor that paged me" to "here's an example traced request".
Exemplars aren't the end all be all and I made sure to note that they have a place as a starting point to gather context and understanding of the services involved in a request before diving into comparing traces before and after getting paged or aggregate trace analysis like grouping by type of error, or correlating top span tags present. But I do stand by my belief that sprinkling some exemplars on metrics can serve as a great bridge and trace onboarding experience for devs who are unfamiliar or skeptical of tracing.
If you'd like to play around with attaching OTel traces to Prometheus metrics in Python, check out Lab 6 of Intro to Instrumentation!
...
If you are interested in contributing exemplar support for the Python SDK, I've gathered the resources I used for my initial research spike:
- The open issue on the Python repo
- The OTel Metrics Spec - Exemplars & more detailed OTel Metrics SDK Spec - Exemplars
- Spec Compliance Matrix highlighting key features needed
I'd also recommend reviewing the existing implementations over in the Java and Go SDKs for more deets.
One other note - after a lovely chat with Ashish Hanwadikar of Kloudfuse I realized there are a lot of questions about exemplars I hadn't considered. Like the user experience when traces and metrics have different retention policies, what happens to exemplars as metrics are downsampled, the storage cost/considerations when adding exemplars, and what (if any) smartness you can add in for selecting the most representative trace to serve as an exemplar. Lots of food for thought I'll be mulling over....
What Could Go Wrong with a GraphQL Query and Can OpenTelemetry Help?
I cannot resist a talk that poses such an innocent question as "What Could Go Wrong...." 😅 especially for a piece of tech that I really side-eyed when it first came out. The cherry on top was Budhaditya Bhattacharya who brought the energy up and delivered an informative action-packed talk to close out the day. Kudos!
I learned that GraphQL can return a 200 OK even for requests with errors which is why setting span status manually is your bff. Common problems that arise are over- and under-fetching, errors that occur upstream or within the resolver, N+1, cyclical queries, and query depth/complexity. Woof!
The beautiful thing though is with the power of tracing uncovering these issues can be straightforward. Highly recommend checking the slides for the full scoop - I found an earlier incarnation from KubeCon Amsterdam here: https://www.slideshare.net/slideshow/what-could-go-wrong-with-a-graphql-query-and-can-opentelemetry-help-kubecon-amsterdam-2023/262093646.
CAT TAX
Norman wishes you all happy observing
Member discussion